ScottPlot is a free and open-source plotting library for .NET. This package can be used to create static plots, and user controls for displaying plots interactively are available as separate NuGet packages.
Get Started
$ dotnet add package ScottPlotReadme
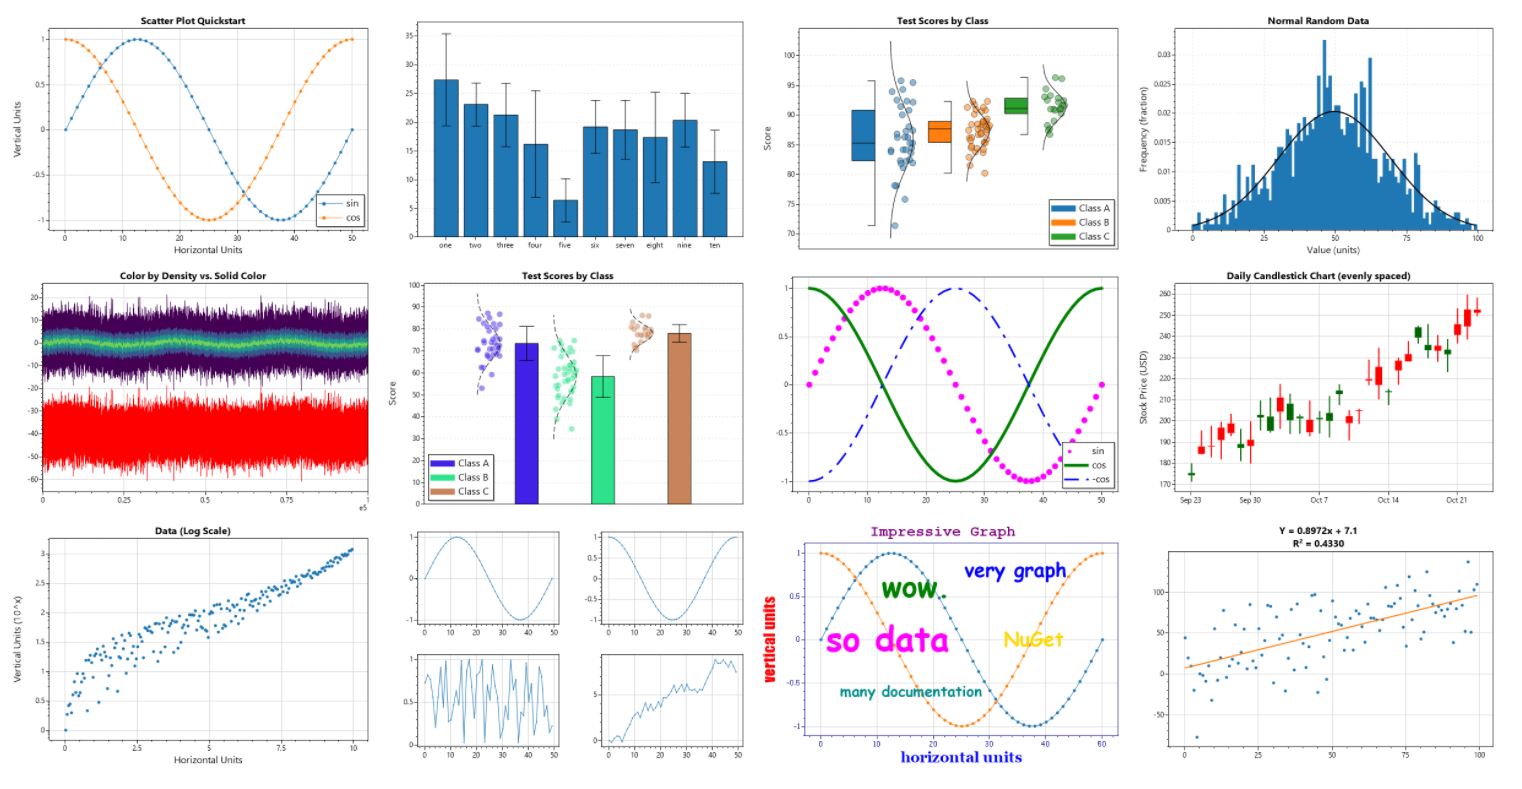
ScottPlot is a free and open-source plotting library for .NET that makes it easy to interactively display large datasets.
The ScottPlot Cookbook demonstrates how to create line plots, bar charts, pie graphs, scatter plots, and more with just a few lines of code.
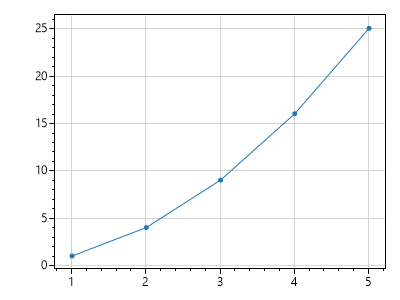
Quickstart
double[] xs = new double[] {1, 2, 3, 4, 5};
double[] ys = new double[] {1, 4, 9, 16, 25};

var plt = new ScottPlot.Plot(400, 300);
plt.AddScatter(xs, ys);
plt.SaveFig("console.png");
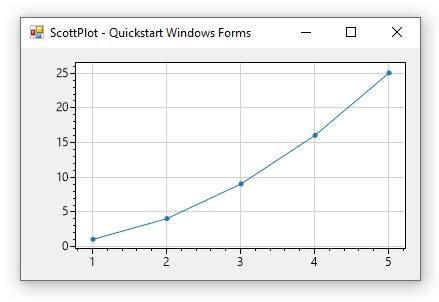
Windows Forms Quickstart
Drop a FormsPlot from the toolbox onto your form and add the following to your start-up sequence:
double[] xs = new double[] {1, 2, 3, 4, 5};
double[] ys = new double[] {1, 4, 9, 16, 25};
formsPlot1.Plot.AddScatter(xs, ys);