.NET Client library for prometheus.io
It was started as a fork of prometheus-net, but over time the library was evolved into a different product. Our main goals:
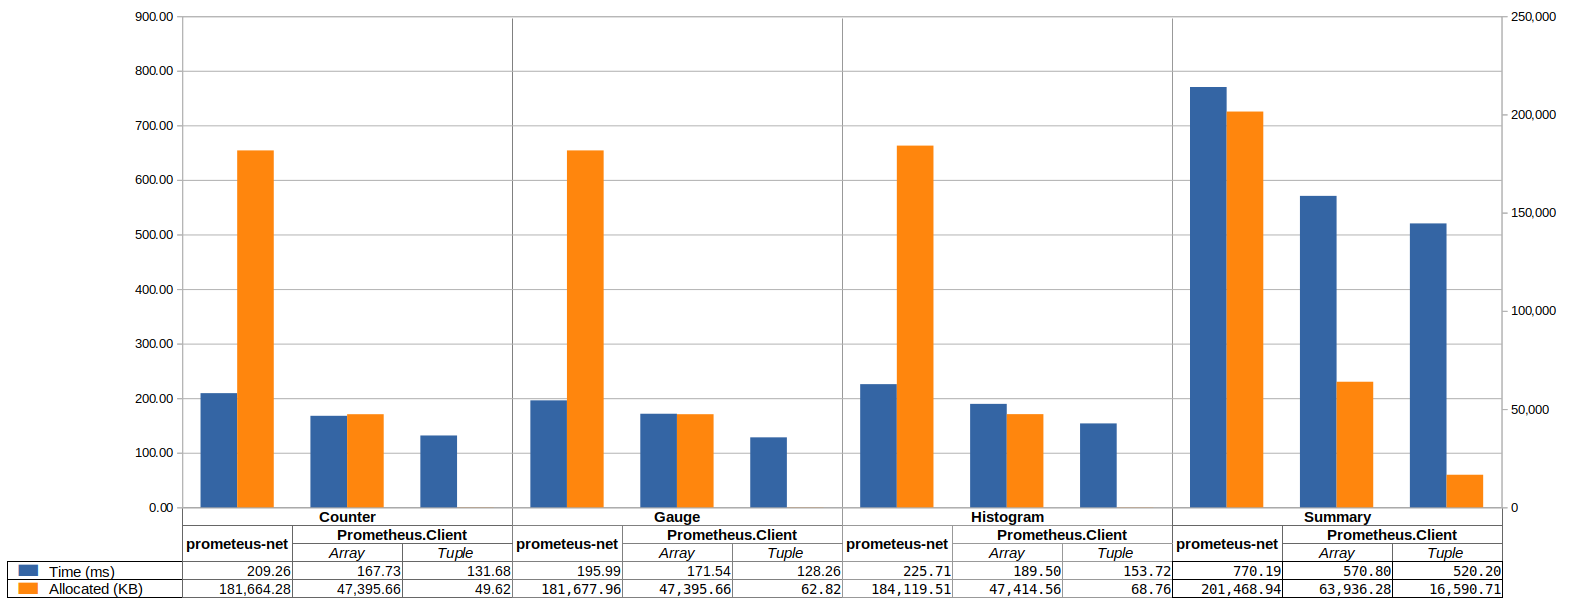 Find more details on benchmarks description
dotnet add package Prometheus.Clientpublic void ConfigureServices(IServiceCollection services)
{
services.AddMetricFactory();
}With Prometheus.Client.AspNetCore:
public void Configure(IApplicationBuilder app, IHostingEnvironment env, ILoggerFactory loggerFactory, IApplicationLifetime appLifetime)
{
    app.UsePrometheusServer();
}
Without extensions:
[Route("[controller]")]
public class MetricsController : Controller
{
    private readonly ICollectorRegistry _registry;

    public MetricsController(ICollectorRegistry registry)
    {
        _registry = registry;
    }

    [HttpGet]
    public async Task Get()
    {
        Response.StatusCode = 200;
        await using var outputStream = Response.Body;
        await ScrapeHandler.ProcessAsync(_registry, outputStream);
    }
}
For collect http requests, use Prometheus.Client.HttpRequestDurations. It does not depend of Prometheus.Client.AspNetCore, however together it's very convenient to use:
public void Configure(IApplicationBuilder app, IHostingEnvironment env, ILoggerFactory loggerFactory, IApplicationLifetime appLifetime)
{
    app.UsePrometheusServer();
    app.UsePrometheusRequestDurations();
}Four types of metric are offered: Counter, Gauge, Summary and Histogram. See the documentation on metric types and instrumentation best practices on how to use them.
Counters go up, and reset when the process restarts.
var counter = metricFactory.CreateCounter("myCounter", "some help about this");
counter.Inc(5.5);Gauges can go up and down.
var gauge = metricFactory.CreateGauge("gauge", "help text");
gauge.Inc(3.4);
gauge.Dec(2.1);
gauge.Set(5.3);Summaries track the size and number of events.
var summary = metricFactory.CreateSummary("mySummary", "help text");
summary.Observe(5.3);Histograms track the size and number of events in buckets. This allows for aggregate calculation of quantiles.
var hist = metricFactory.CreateHistogram("my_histogram", "help text", buckets: new[] { 0, 0.2, 0.4, 0.6, 0.8, 0.9 });
hist.Observe(0.4);
The default buckets are intended to cover a typical web/rpc request from milliseconds to seconds.
They can be overridden passing in the buckets argument.
All metrics can have labels, allowing grouping of related time series.
Taking a counter as an example:
var counter = metricFactory.CreateCounter("myCounter", "help text", labelNames: new []{ "method", "endpoint"});
counter.WithLabels("GET", "/").Inc();
counter.WithLabels("POST", "/cancel").Inc();
Since v4 there is alternative new way to provide a labels via ValueTuple that allow to reduce memory allocation:
var counter = metricFactory.CreateCounter("myCounter", "help text", labelNames: ("method", "endpoint"));
counter.WithLabels(("GET", "/")).Inc();
counter.WithLabels(("POST", "/cancel")).Inc();AspNetCore Middleware: Prometheus.Client.AspNetCore
dotnet add package Prometheus.Client.AspNetCoreDependencyInjection support: Prometheus.Client.DependencyInjection
dotnet add package Prometheus.Client.DependencyInjectionCollect http requests duration: Prometheus.Client.HttpRequestDurations
dotnet add package Prometheus.Client.HttpRequestDurationsPush metrics to a PushGateway: Prometheus.Client.MetricPusher
dotnet add package Prometheus.Client.MetricPusherStandalone Kestrel host: Prometheus.Client.MetricServer
dotnet add package Prometheus.Client.MetricServerHealthChecks Publisher Prometheus.Client.HealthChecks
dotnet add package Prometheus.Client.HealthChecksContributions to the package are always welcome!

We much appreciate free licenses provided by JetBrains to support our library.
Thanks Promitor for supporting us via GitHub Sponsors.
All contents of this package are licensed under the MIT license.


