SyncfusionInc/Syncfusion.Maui.Chartsv32.2.8
✓ Verified.NET 9.0.NET 9.0-android34.0.NET 9.0-ios16.1.NET 9.0-maccatalyst16.1
Syncfusion® .NET MAUI Charts provides a perfect way to visualize data with a high level of user interactivity that focuses on development, productivity and simplicity of use. Its rich feature set will include functionalities like data binding, multiple axes, animations, data labels, tooltips, selection, and zooming.
Get Started
$ dotnet add package Syncfusion.Maui.ChartsReadme
Syncfusion.Maui.Charts Components
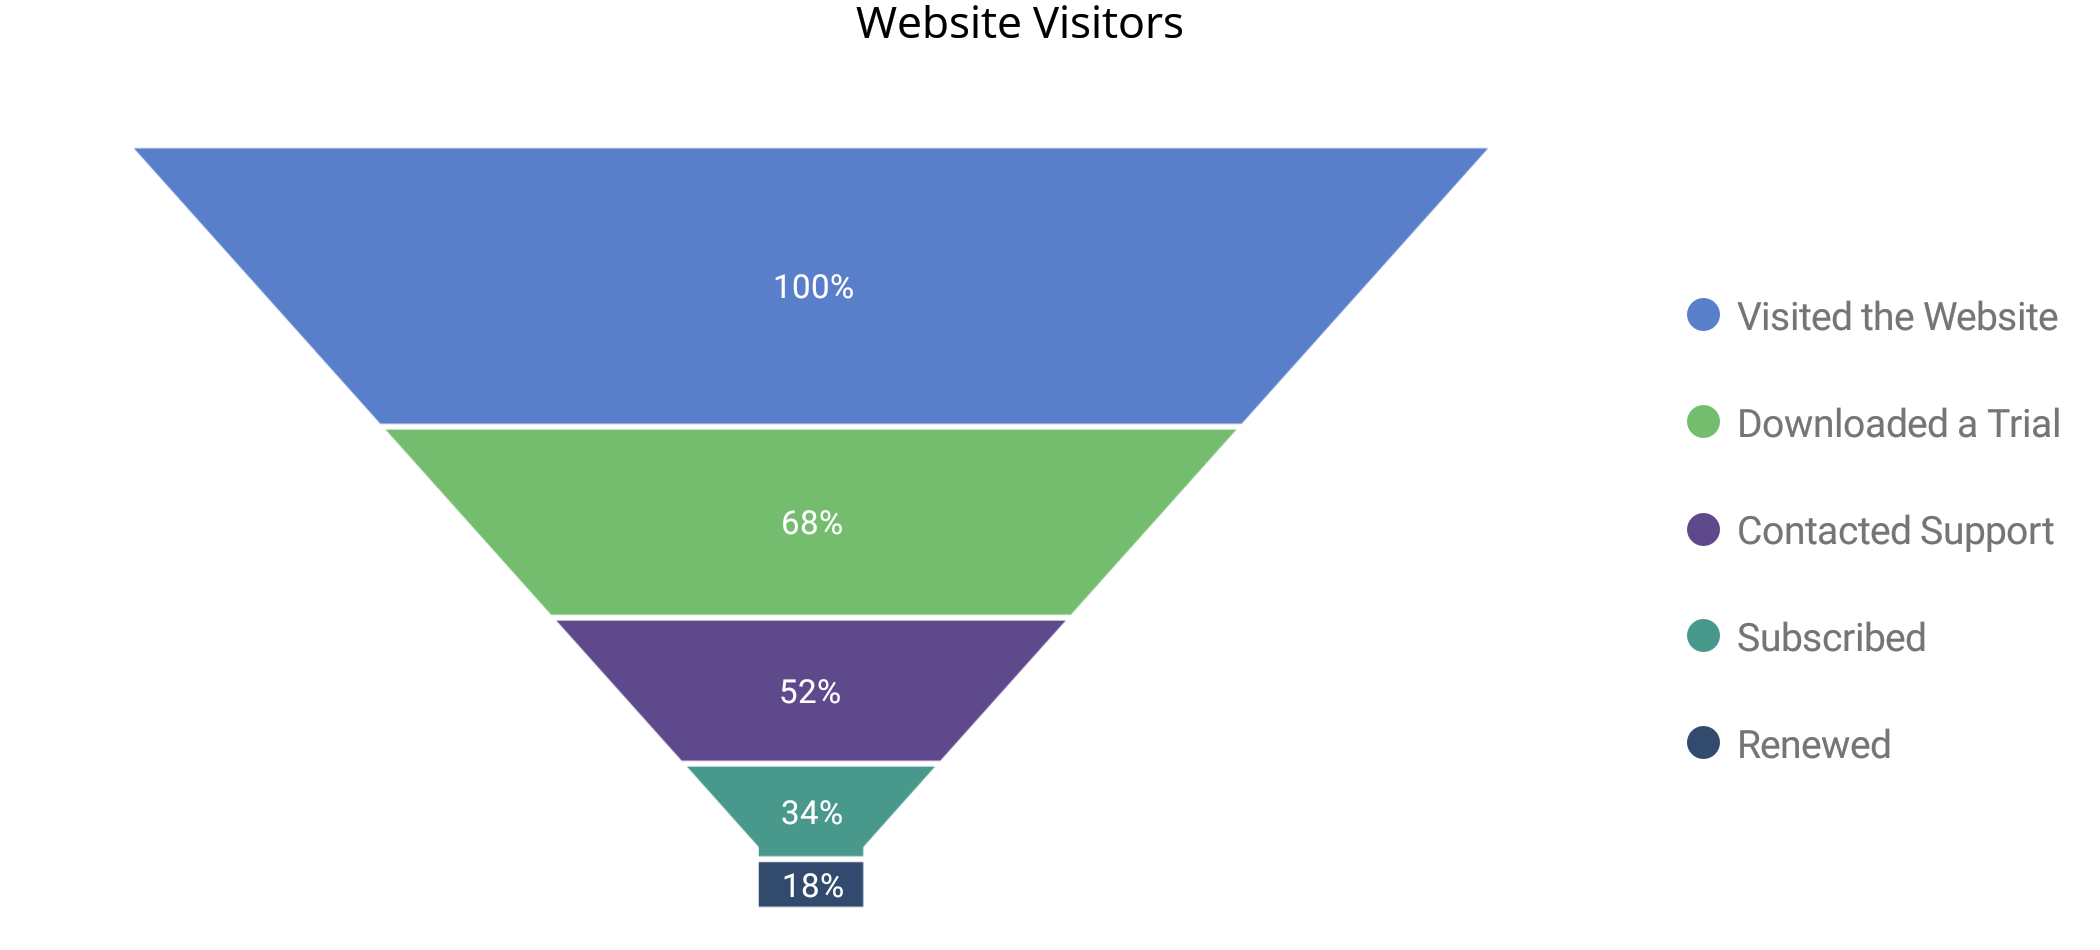
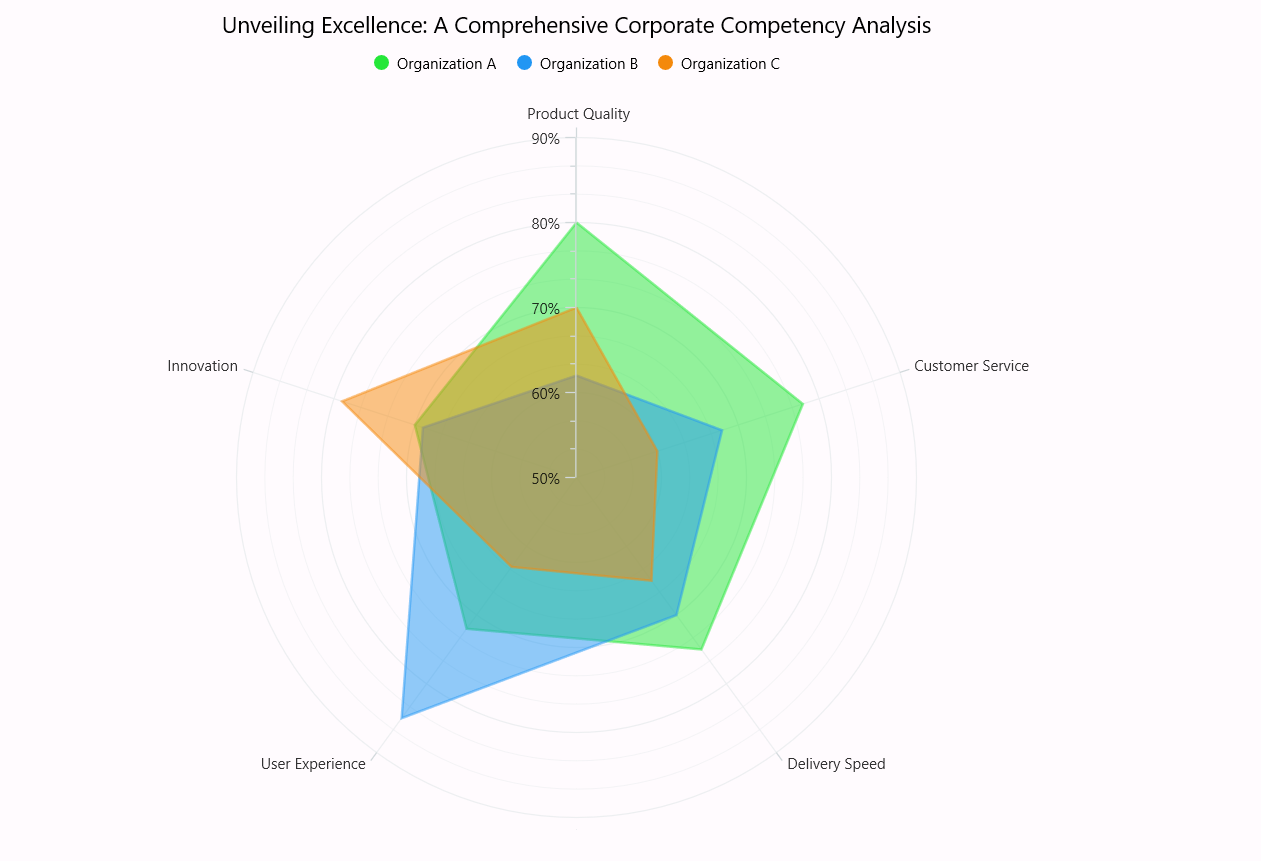
This package contains .NET MAUI Cartesian Charts, .NET MAUI Circular Charts, .NET MAUI Funnel Charts, .NET MAUI Pyramid Charts, .NET MAUI Polar Charts components for .NET MAUI application.
System Requirements
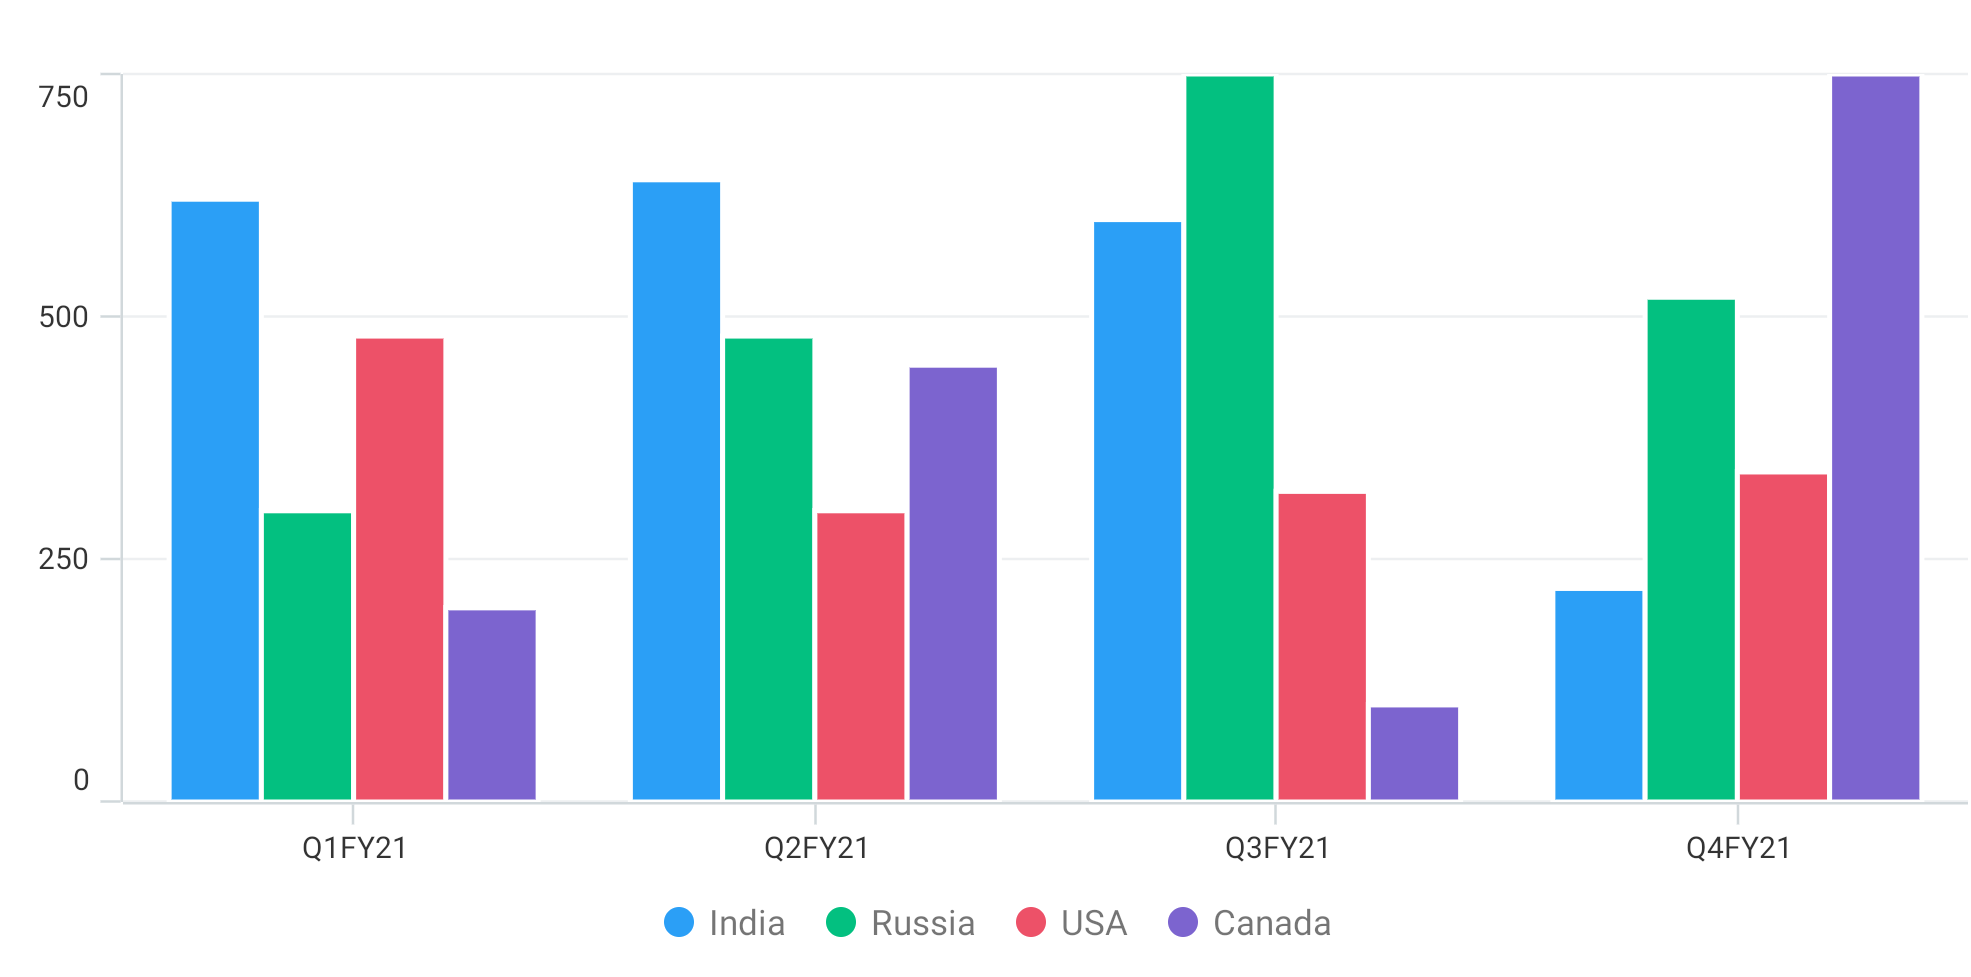
Cartesian Charts
The Syncfusion® .NET Cartesian Chart is a two-dimensional Cartesian coordinate system data visualization tool. It enables users to build and customize the charts, such as line charts, area charts, column charts, scatter charts, and more.
Features Overview | Docs | Online Demo | Support | Forums | Feedback
Getting Started
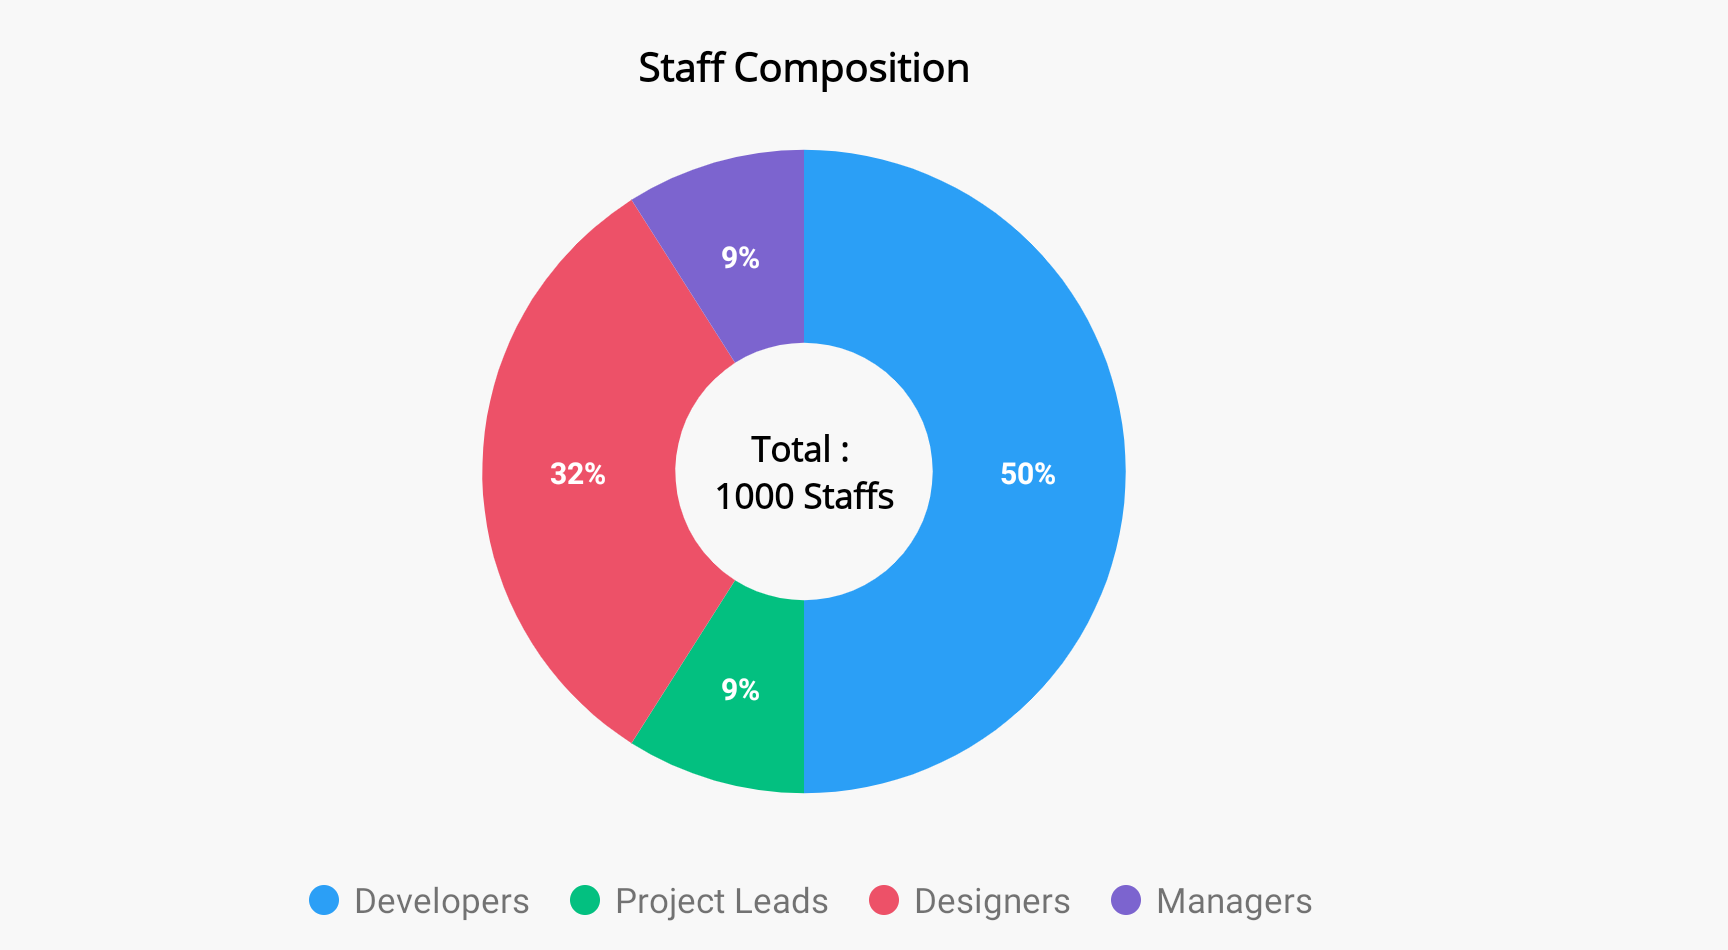
Circular Charts
The Syncfusion® .NET MAUI Circular Chart displays data on a circular coordinate system, with sectors, slices, segments, or arcs representing the data. It enables users to build and customize different kinds of circular charts, such as pie charts, doughnut charts, and radial bar charts.
Features Overview | | | | |