Financial charts. More info on web site https://stocksharp.com/store/
Get Started
$ dotnet add package StockSharp.Xaml.ChartingReadme
📊 StockSharp.Xaml.Charting – WPF Charting Library
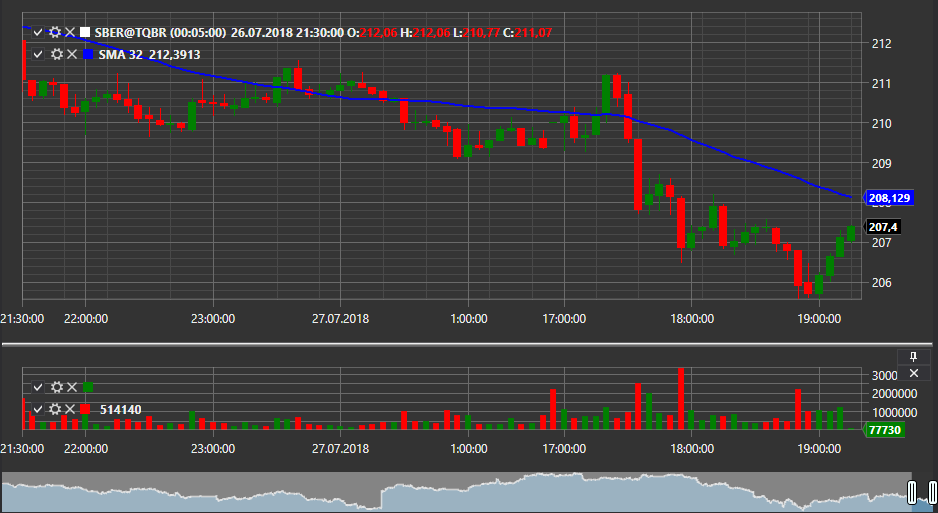
Powerful and flexible WPF charting component for trading applications. Supports candles, indicators, order book, trades, and much more.
✨ Features
- Candle Charts – Render price candles for any timeframe
- Indicators Overlay – Add built-in or custom indicators to any chart
- Trades Visualization – Show buy/sell trades directly on the chart
- Order Book (Market Depth) Charts – Visualize L2 order book as histograms
- Custom Drawing – Draw lines, shapes, and highlights for analytics
- Interactive Zoom & Pan – Full mouse navigation and touch support
- WPF Native – Easy integration into .NET and StockSharp projects
📦 Main Components
- ChartArea – Host for multiple chart panels
- ChartPanel – Contains candles, trades, order book, and drawings
- ChartIndicatorElement – Render indicators as overlays or separate panels
- Custom Tools – Vertical/horizontal lines, markup, highlights
🛠️ Visualization Types
- Candles (OHLC, HLC, Line, Area, Range, Renko, P&F)
- Market Depth / DOM
- Tick charts
- Order/Trade markers
- Indicators (MA, Bollinger, RSI, and more)