pkg
vanKraster/PerformanceDebugOverlayv3.0.0
.NET 10.0-android36.0.NET 10.0-ios26.0.NET 10.0-maccatalyst26.0.NET 10.0-windows10.0.19041
MAUI Performance Overlay – a lightweight, draggable performance HUD for .NET MAUI apps. Provides real-time metrics: FPS, frame time, CPU and memory usage, active threads, GC collections, allocations per second, battery consumption (Android only), and networking statistics (requests, bytes sent/received, average response time). Tracks load time per component, calculates an overall performance score, and offers AI-powered performance insights and recommendations via Gemini integration. Cross-platform support: Android, iOS, MacCatalyst, Tizen, and Windows. Seamlessly integrates into your app to deliver real-time diagnostics, profiling, and AI-driven optimization tips.
Get Started
$ dotnet add package PerformanceDebugOverlayReadme
## PerformanceDebugOverlay (v3.0.0)
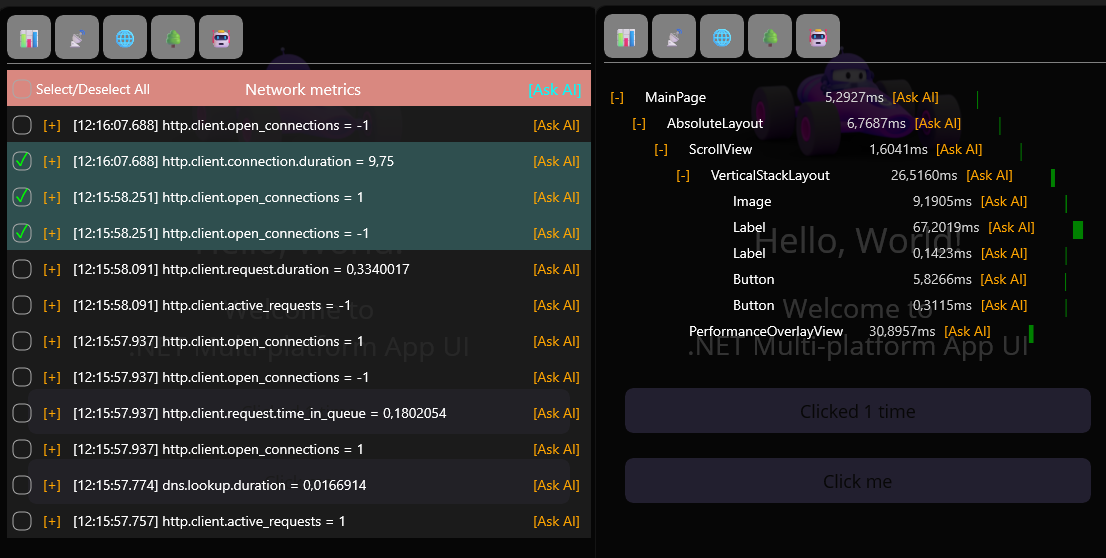
A real-time performance overlay for .NET MAUI that tracks FPS, CPU, memory, GC, battery, and network usage, while providing a load-time component tree—all without major changes to your app code.
## Features
FPS & FrameTime – calculated using EMA (Exponential Moving Average)
CPU usage – per-process CPU utilization ( not available on iOS )
Memory usage – current memory and allocations/sec
GC activity – collections per generation
Battery consumption – approximate consumption in mW (Android only)
Network stats – total requests, bytes sent/received, average request time + AI
Compact / Expanded view – show/hide individual metrics
Live drag & reposition – move the overlay freely at runtime
Plug-and-play integration – works globally without modifying existing HTTP code
Tree View of Load-Time Components with Metrics + AI
Collapse/Expand tree view items
Scrollable TreeView
AI assistance for performance improvement suggestions ( use your own Gemini API key )
## Installation
Add the NuGet package to your project:
dotnet add package PerformanceDebugOverlay --version 3.0.0
## Configuration
in MauiProgram.cs
using MauiPerfDebugOverlay.Extensions;
using MauiPerfDebugOverlay.Models;

public static class MauiProgram
{

  public static MauiApp CreateMauiApp()
  {
     var builder = MauiApp.CreateBuilder();

     builder
         .UseMauiApp<App>()
         .UsePerformanceDebugOverlay(new PerformanceOverlayOptions

         {
             ShowBatteryUsage = true,
             ShowNetworkStats = true,
             ShowAlloc_GC = true,
             ShowCPU_Usage = true,  //NOT AVAILABLE ON iOS
             ShowFrame = true,
             ShowMemory = true,
             ShowLoadTime = true,
             LoadTimeDanger = 200,
             LoadTimeWarning = 450
             GeminiAPIKey = "YOUR_API_KEY" // optional
         });
     return builder.Build();
  }
}
Options are optional and can be enabled or disabled individually.
Activation in Your App
In App.xaml.cs:
public App()
{
 InitializeComponent();

 // Enable the PerformanceOverlay globally

 PerformanceOverlayManager.Instance.Enable();
 MainPage = new AppShell();
}
The overlay will appear automatically and is interactive.
## Notes
Battery consumption metrics are only available on Android. Other platforms will display N/A.
Networking metrics automatically monitor all HttpClient and HttpWebRequest requests without modifying existing code.
Overlay is fully configurable and extensible.
## Simple API
PerformanceOverlayManager.Instance.Show() – show the overlay


PerformanceOverlayManager.Instance.Hide() – hide the overlay
Configuration is done via PerformanceOverlayOptions to customize which metrics are displayed